
Munich AirBnb Data Analysis
Motivation
AirBnb is one of the most successful platforms for apartment rentals world wide. Due to the high housing prices in San Francisco, the original idea of the AirBnb founders was to allow users offering a free bed to travellers to make some extra money. Nowadays AirBnB not only offers short-term rentals at some hosts private apartment but also hotel rooms, long-term apartment rentals and bookable experiences.
In the following blog post I will analyze AirBnB data from Munich, one of the most famous cities of Europe (especially because of the popular Oktoberfest).
Objectives
This project aims to get a better understanding of the AirBnB market in Munich. Therefore I’ll try to find answers to the following four questions:
-
Which time is the most expensive / cheapest to travel to Munich?
-
Is making a booking at a certain time of the year more expensive than during the rest of the year?
-
Is it possible to build a model to automatically suggest a price to hosts?
-
Which factors influence the price most and how do they influence it?
Dataset
AirBnb itself doesn’t provide open source data, but a platform called Inside Airbnb scrapes the listings on a monthly basis. I wrote a small web scraper which downloads all the data files that contain data about AirBnbs in Munich.
Essentially Inside Airbnb provides three different files:
- Calendar: contains prices plus minimum nights to stay per listing and date
- Reviews: contains reviewer names and comments for each listing
- Listings: contains information about the Airbnb, the host and the price.
Methodology
To analyze the dataset I follow the CRISP-DM cycle. I start with a quick data exploration, clean the dataset and calculate first moments of the data to answer the first two questions. Afterwards I perform some feature engineering and try to build a pricing model. Later the pricing model will be analyzed to get an idea which features influence the price most.
Exploratory Data Analysis
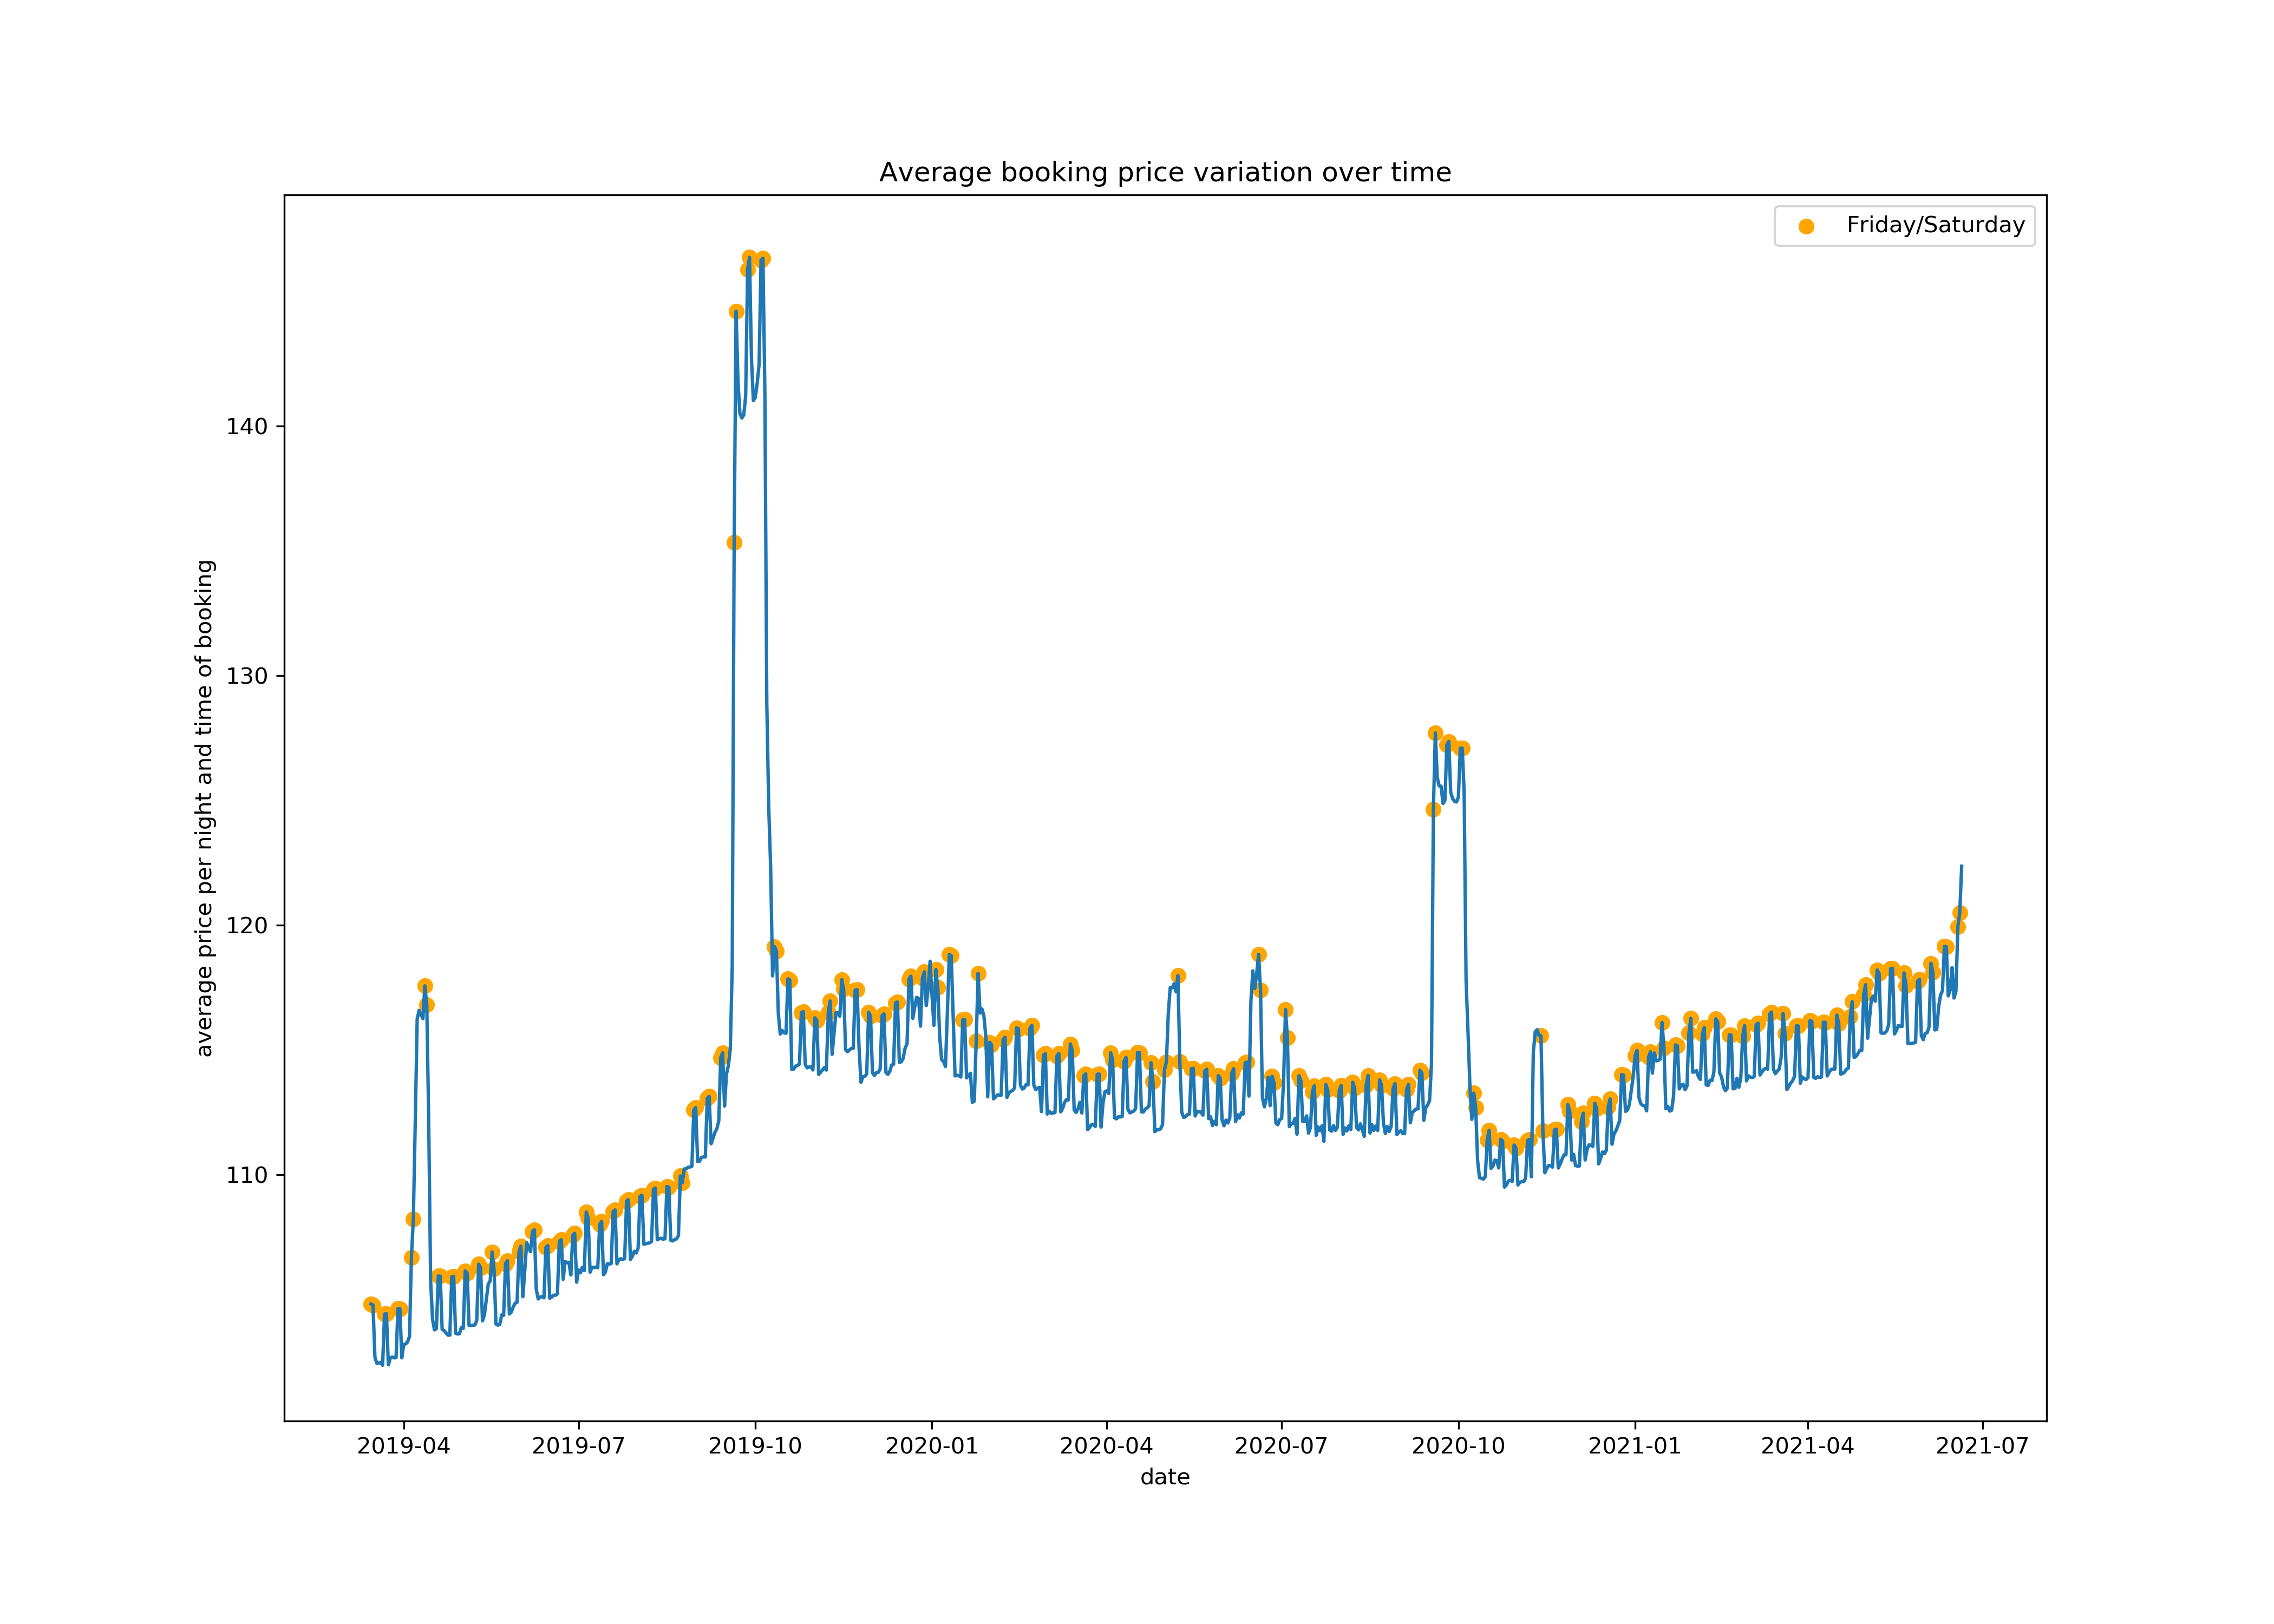
To answer the first two questions I used the calendar dataset to get an impression of the price variation over time. As I assumed the prices are by far the highest during September when the Oktoberfest takes place. Besides there’s a weekly seasonality that shows higher prices during the weekend. The AirBnBs tend to be cheapest during spring. The peak during April is probably due to a hugh spring festival in Munich.
Since its sometimes cheaper or more expensive to book at certain times of a year I investigated if the average booking price varies over time. Therefore I excluded the booking prices of September to remove the high prices during the Oktoberfest and then calculated the average booking prices of all AirBnBs at the time the data has been scraped. 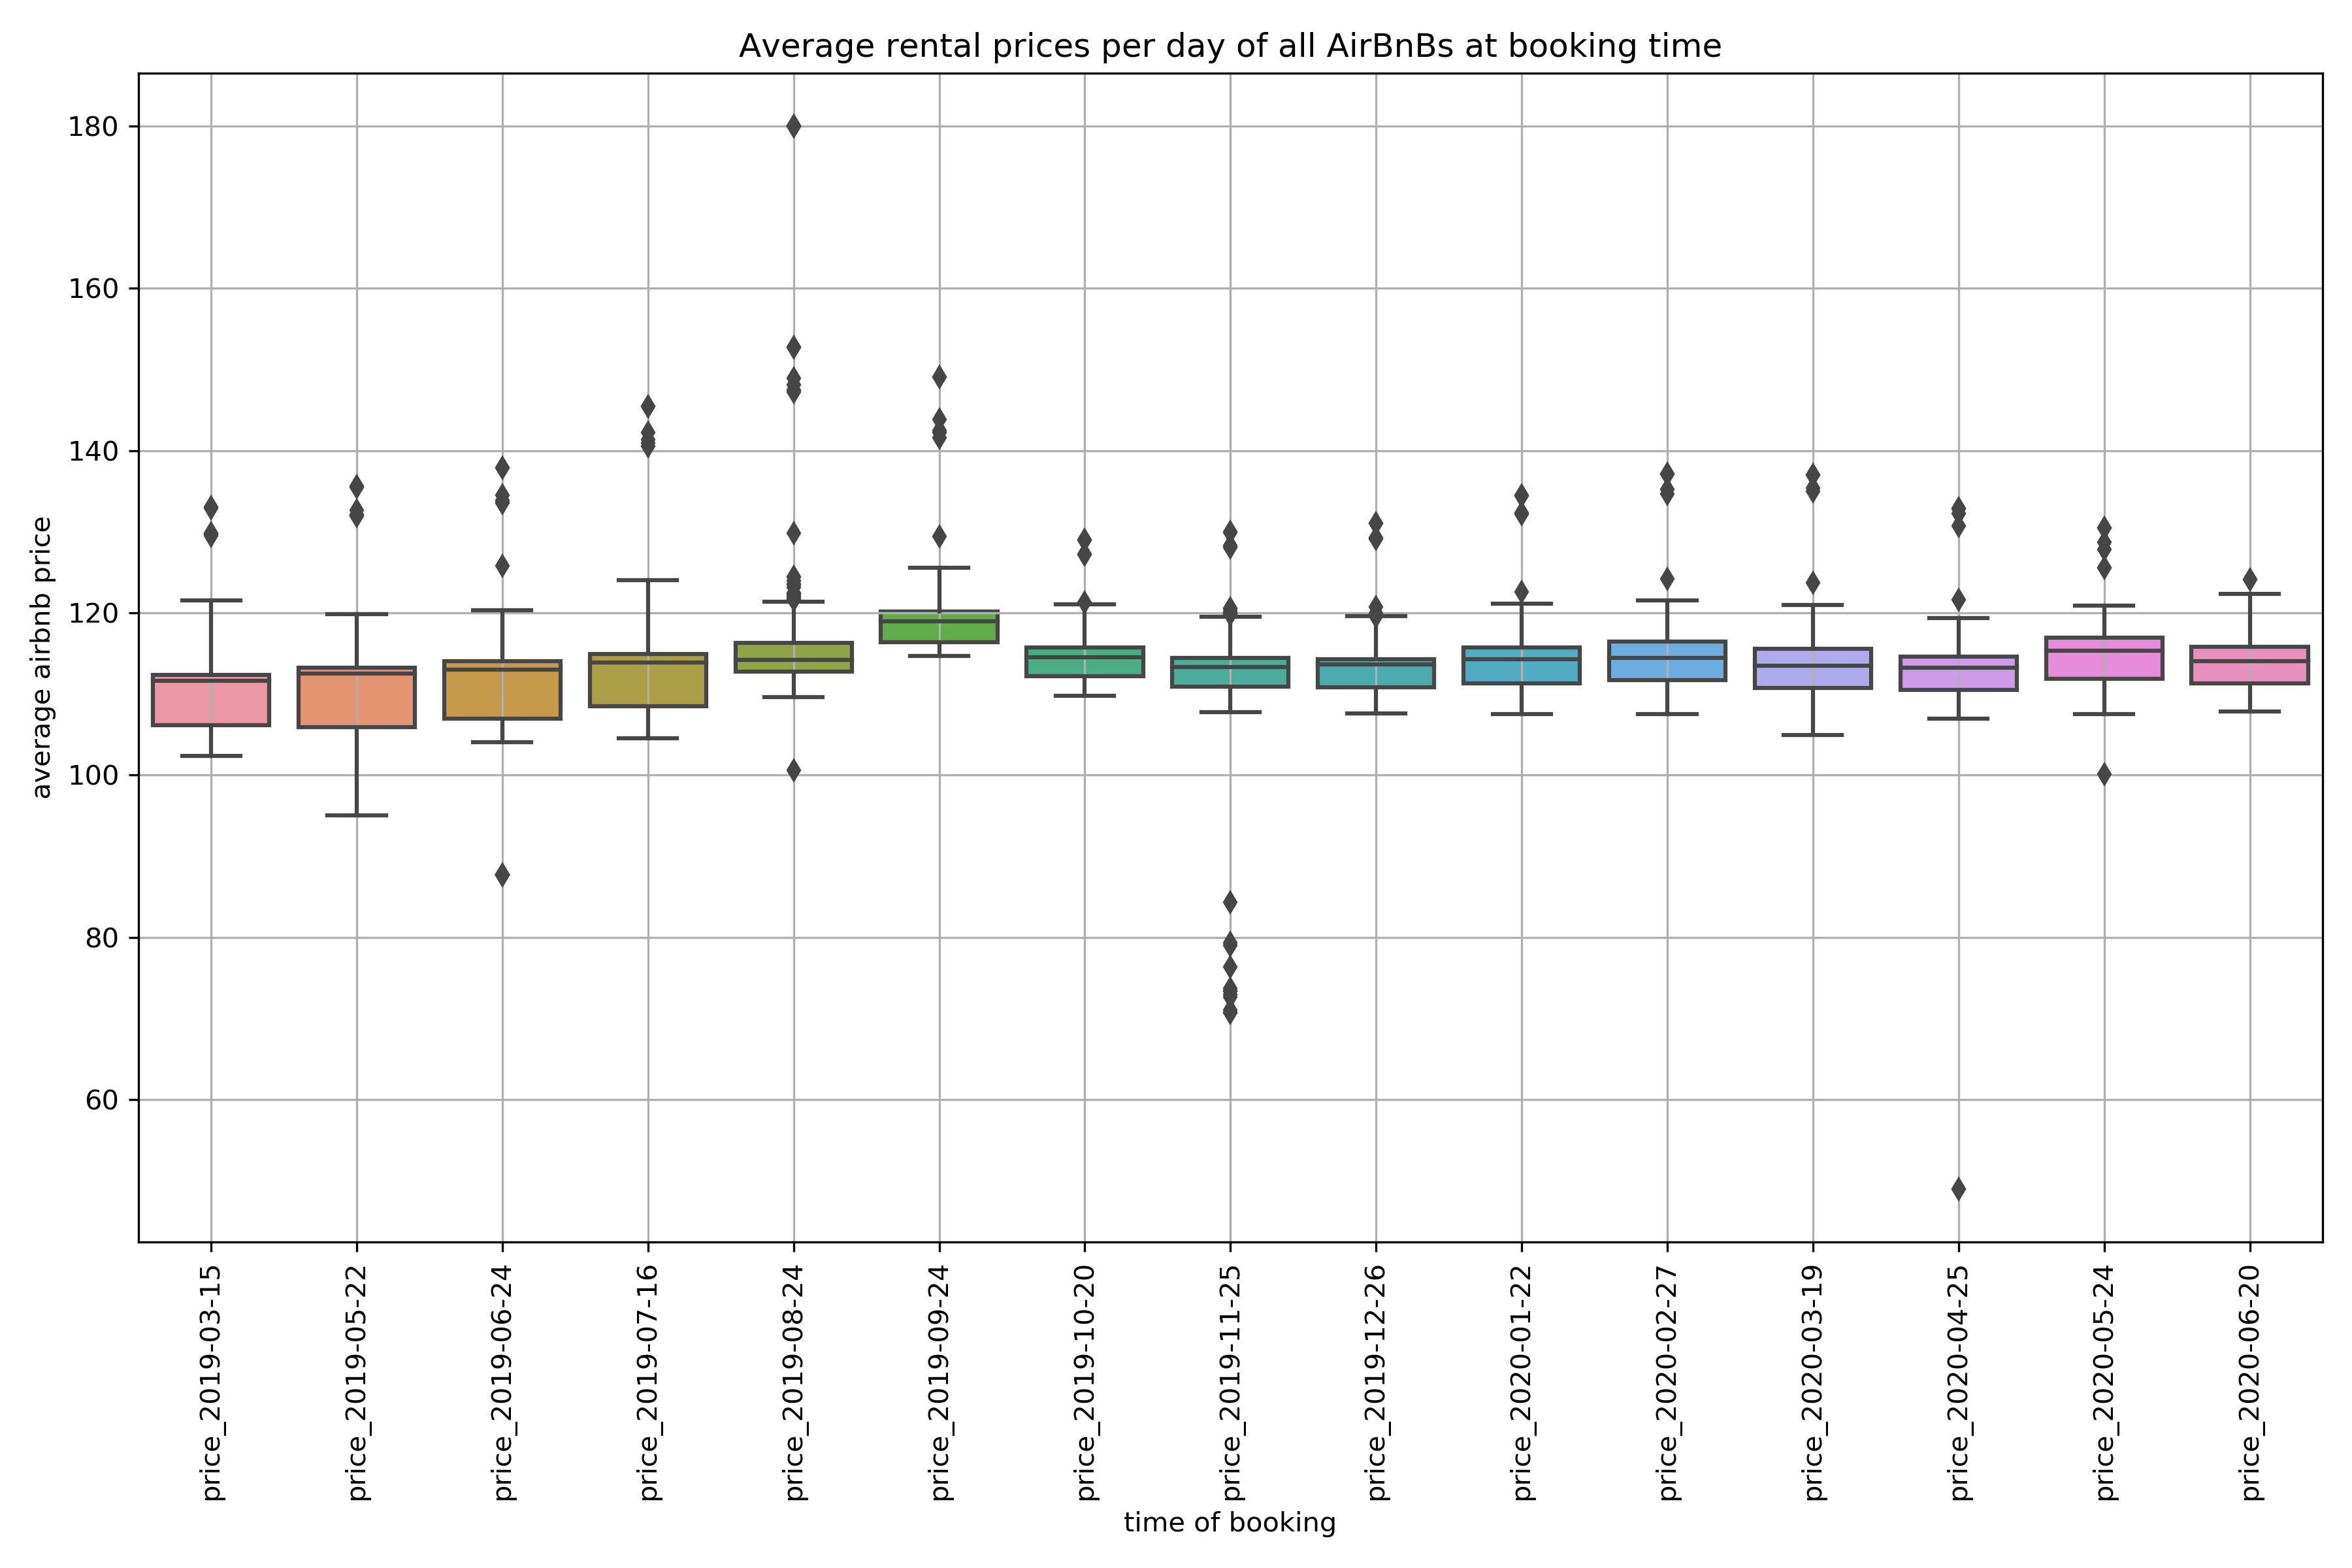 In the boxplot you can see that the average booking prices tend to be higher if the booking is made during August or September. So the Oktoberfest-effect still influences the prices for future rentals, although the rental date is not in September when the Oktoberfest takes place. Thus, if you want to travel to Munich, it is probably cheaper to make the booking in another month.
Data cleaning
To answer the questions about the pricing the listings dataset has been used. The following steps have been neccessary to get a clean listings dataset for further processing:
- Reformat prices
- Drop listings with extremely high or low prices (outliers)
- Drop listings that are duplicates
- Drop listings with missing geolocation
- Drop inactive listings (no activity in 365 days)
Feature Engineering
Transformation of categorical variables
The dataset contains several categorical variables like amenities or the neighbourhood that are transformed into dichotomous variables by using one-hot-encoding.
Especially one-hot-encoding the amenities resulted in a large amount of features (146 features). Some amenities have been merged, e.g. “TV”, “Cable TV” and “Smart TV” are considered as one feature “TV”. Furthermore the total amount of amenities has been calculated.
Text-based features
Although reviews and descriptions of AirBnBs probably contain valuable information I haven’t performed advanced natural language processing (NLP). I only created two text-based features:
- A binary variable containing information about an existing roof top terracce (since roof top terracces in cities are super cool and could increase the price).
- One possible driver of the price could be the size of the AirBnb. Since the feature “square_feet” is missing in most cases, i tried to get that information from the description feature. I used regular expressions to search for the unit square meters (and at least most possible abbreviations of it) to find numbers related to the size.
listings['description'] = listings['description'].str.replace("MBit|Mbit|mbit|Min|min|minutes|minute|meter"," ") # removes everything definitely related to time to avoid confusions between size unit and time or bandwidth units

listings['size'] = listings['description'].str.extract(u'(\d{2,3}\s*?(m²|qm|sq|sm|quadratmeter|meter²|meters²))',expand=True, flags=re.IGNORECASE)[0]
Binning of numerical features
There are several features containing rates or review scores (e.g. for cleanliness or location). I used binning to build groups of these features since e.g. scores that are below 8/10 points can be considered as bad on AirBnB.
Location based features
The dataset provides the latitude and longitude of each AirBnb. I’ve looked up the geo-coordinates of several points of interest in Munich (e.g. where the Oktoberfest takes place or the Marienplatz, which is more or less the city center) and calculated the haversine distance to these points. Afterwards I’ve calculated the average distance to all points of interest as additional feature.
Time based features
The features “host_since”, “first_review” and “last_review” represent timestamps which have been used to calculate the elapsed time till today.
Feature selection
To reduce the high dimensionality of the dataset, several feature selection steps have been performed:
- Manually selected amenities that are more likely to influence the price.
- Used correlations to find collinear features and remove highly correlated features.
- Dropped binary features with low variance.
- Dropped features with more than 80% of missing values.
After performing the feature selection the dataset consisted of 95 features.
Modeling
To predict the AirBnB prices I trained a regression model with the XGBoost algorithm.
Although XGBoost is able to handle missing values, all numerical features have been imputed with an Iterative Imputer (which is basically an iterative Bayesian Ridge regression). Neither feature transformations nor scaling has been used since XGBoost (and tree-based models in general) are invariant to monotonic transformations like log-transform, etc..
XGBoost has a large number of parameters which can be tuned. To speed up the hyperparameter tuning Randomized Search has been used instead of a gridsearch.
param_grid = {'xgb__n_estimators': [1500, 2000, 3000],
              'xgb__learning_rate': [0.01, 0.05, 0.1],
              'xgb__max_depth': [3, 6, 8],
              'xgb__colsample_bytree': [0.6, 0.7, 0.8],
              'xgb__subsample': [0.8,0.9],
              'xgb__min_child_weight': [5,10,15],
              'xgb__reg_alpha': [0, 0.5, 1],
              'xgb__reg_lambda': [2, 3, 4, 5],
              'xgb__gamma': [0.0, 0.2, 0.5]}

# total of 17496 possible parameter combinations
# use randomized search to limit the number of iterations and save time
param_search = RandomizedSearchCV(pipeline, param_grid, cv=3, verbose=True, n_iter=2000, n_jobs=-1)
# perform parameter search
param_search.fit(X_train, y_train)
Afterwards a model has been trained with the best parameter set found. The model has been evaluated using the r-squared at the mean absolut error.
| r-squared | mae | |
|---|---|---|
| Training set | 0.884 | 10.8 |
| Test set | 0.499 | 23.0 |
Since the model only explains parts of the price variance it seems to be influenced by features not available in the dataset and overfits the training set. The mean absolut error is to high to use it for good predictions. Nevertheless the model can help us understanding how the known parameters influence the price.
Model explanation
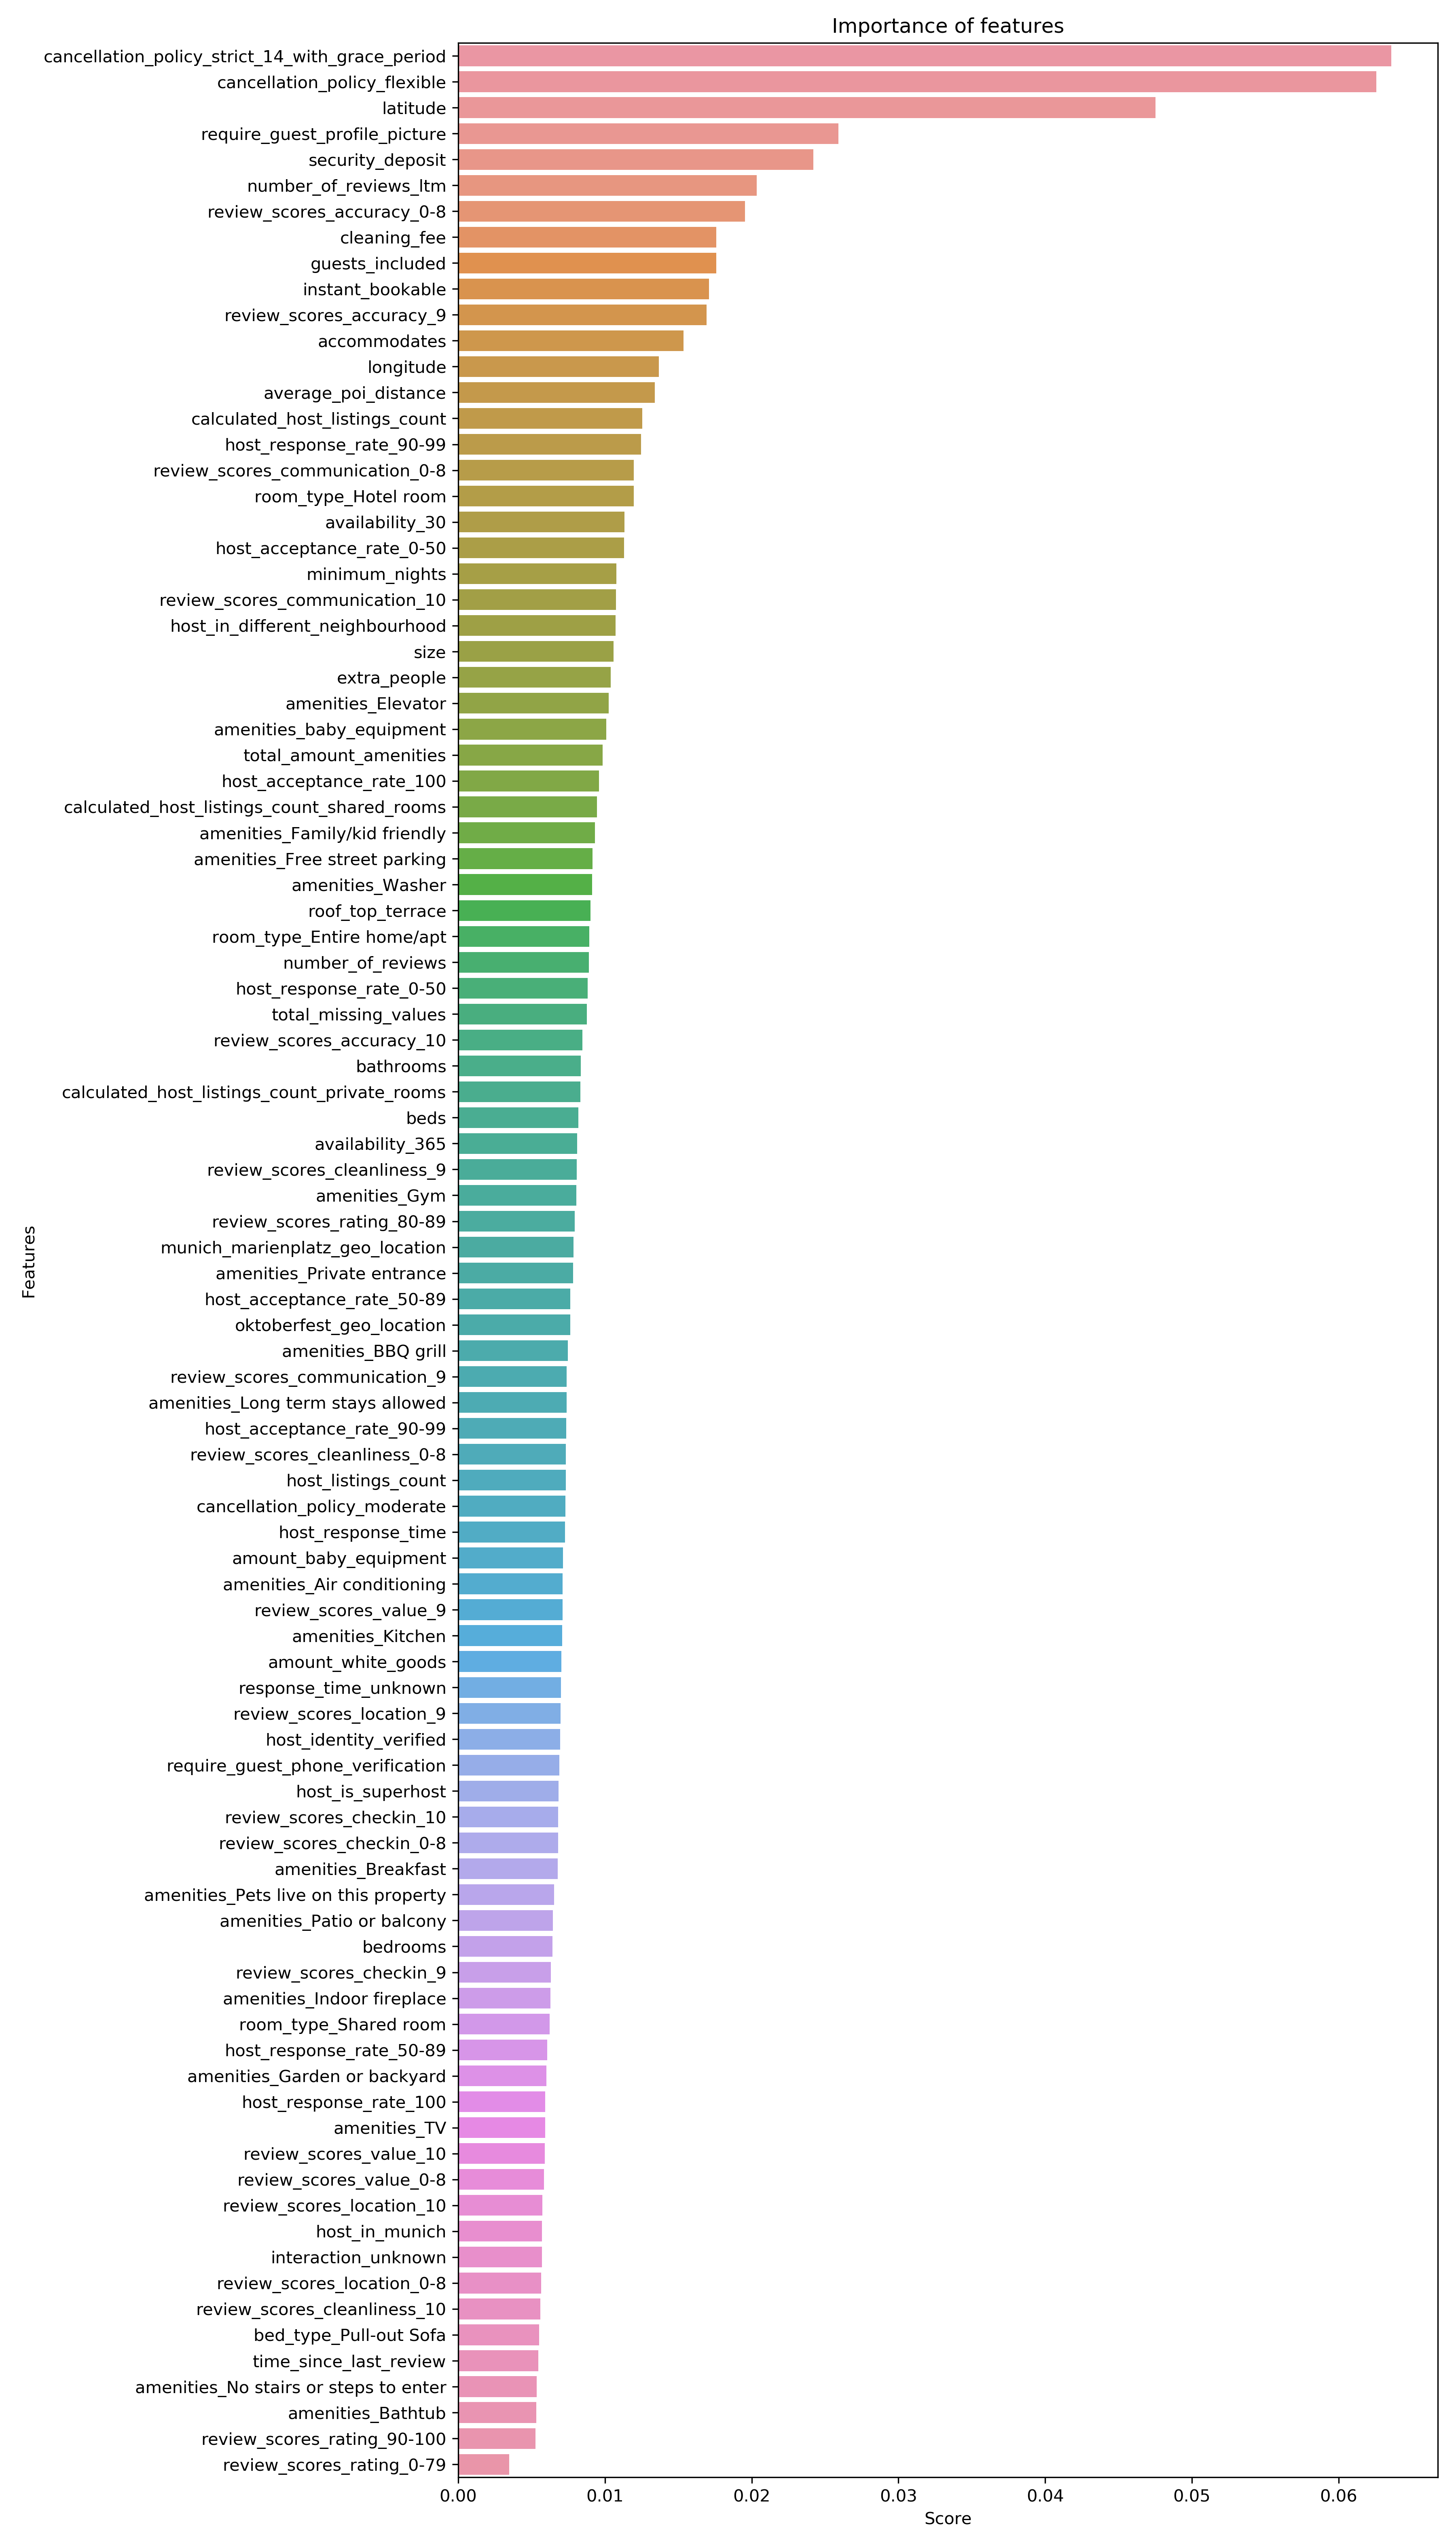
To answer the last question I used the XGBoost feature importance as well as SHAP values. The features with the highest importance for the price predictions of the model are:
- cancellation_policy_stict_14_with_grace_period
- cancellation_policy_flexible
- latitude
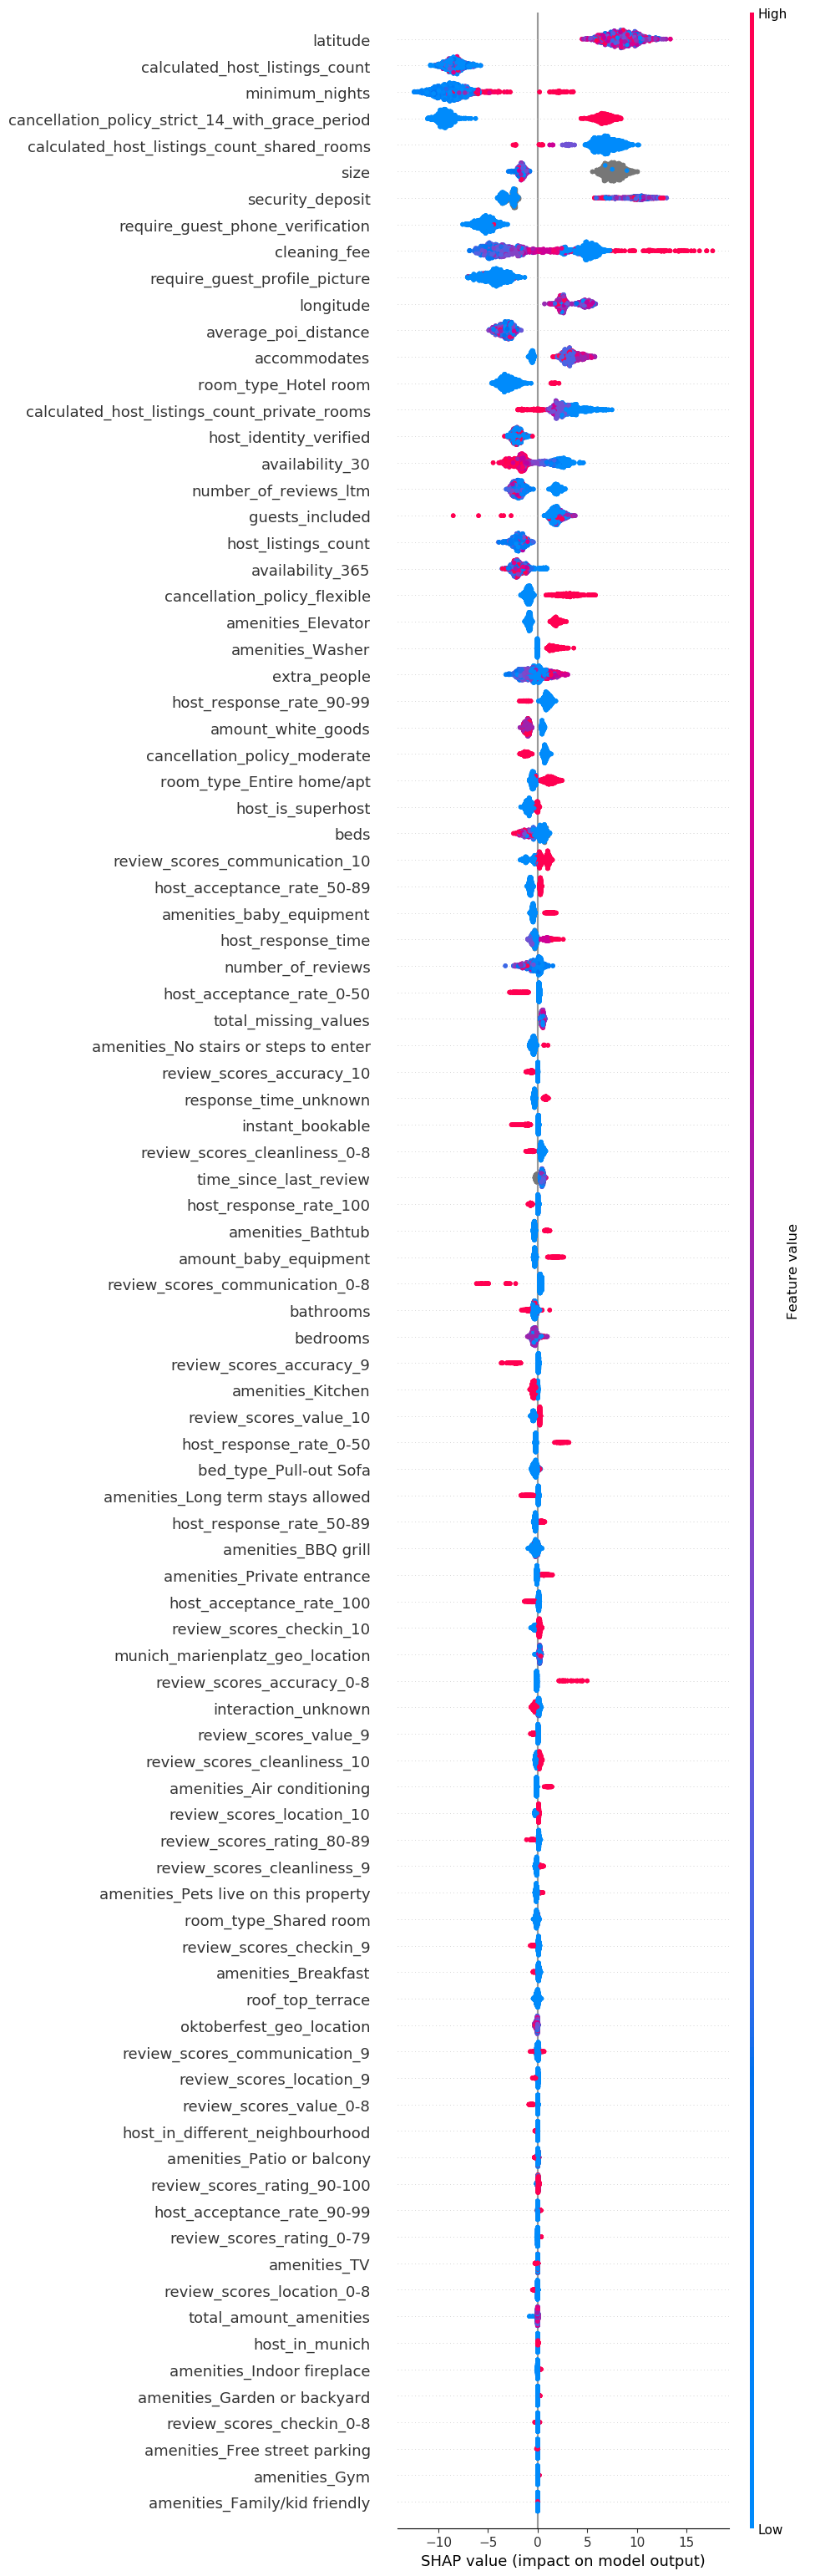
Afterwards I build an explanation model with SHAP. The calculated SHAP values have been used to create a summary plot which shows how feature values influence the price. In the summary plot you can e.g. see that the feature “cancellation_policy_stict_14_with_grace_period” increases the price if it is true and decreases the price if it is false.
Future work
Further data sources could be used to improve the model. The following steps could be worth a try:
- Using natural language processing (NLP) to get information from the reviews
- Using NLP for the description and summary of the listing
- Investigate the photo quality of the listings